 GBP Autopilot
Most business owners check their Google Maps ranking by pulling up Google on their phone and searching for their service. If they see themselves in the top three, they assume they're doing fine. If they don't, they assume something is broken.
Both assumptions miss the real picture.
Geo-grid rank tracking is the technique that shows you where you actually rank across your entire service area — not just from your front door. If you run a plumbing company in Dallas, your geo-grid tells you that you rank #1 for "plumber near me" in a 3-mile radius around your office, but you're #8 in the suburbs 12 miles north where two of your competitors are based.
That's the information that drives real decisions.
The Problem With Checking Your Own Rank
When you search Google from your business address, Google factors in your proximity to your own location. If you've visited your Google Business Profile listing before, or if Google has associated your device with your business, your results are personalized further. You may appear higher than you actually do for the average customer searching across your city.
More importantly, even an accurate rank check from your address only tells you your position for customers physically near your office. It tells you nothing about:
- Customers in neighborhoods 5–15 miles away
- Areas where a competitor has a physical location or stronger signals
- The geographic boundaries of your actual visibility
For service-area businesses especially — where customers are spread across a metro area and you travel to them — a single-point rank check is nearly useless as a strategic tool.
What Geo-Grid Rank Tracking Actually Does
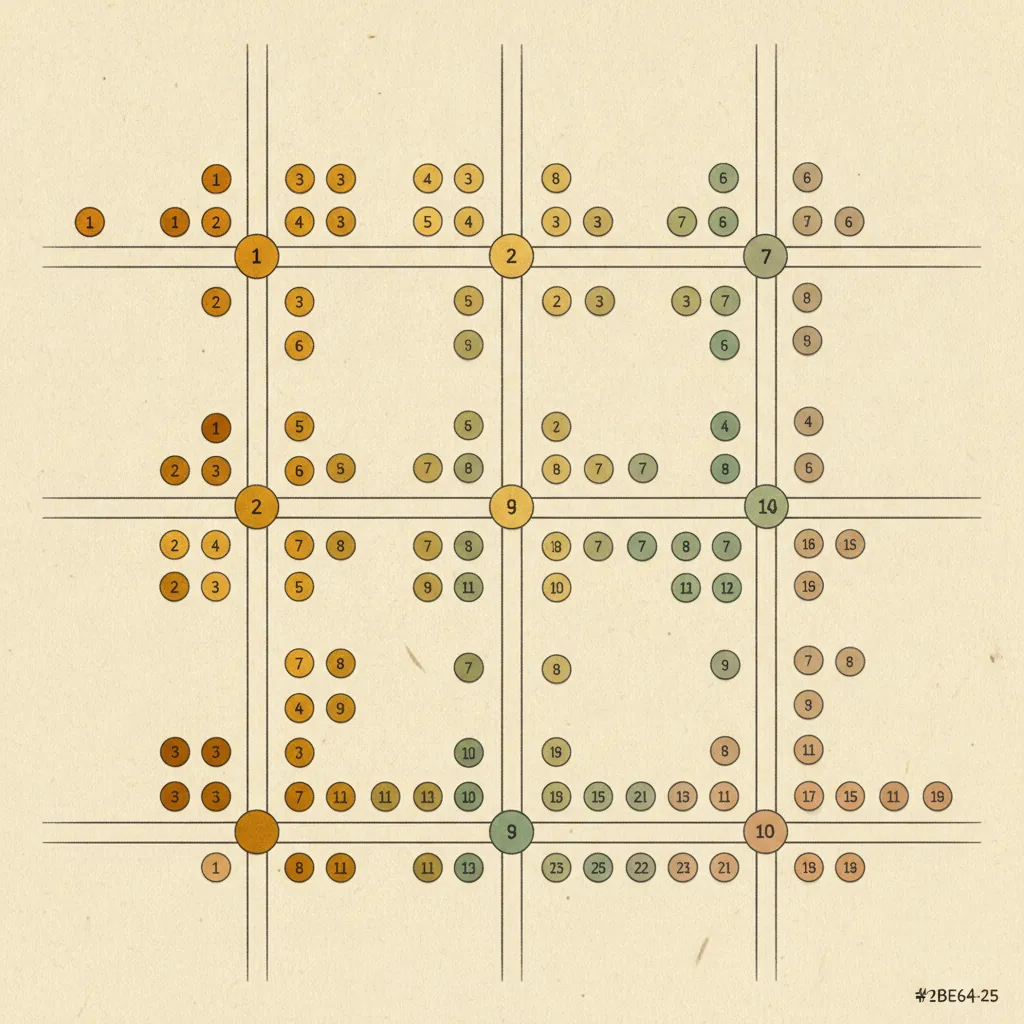
A geo-grid tracker places a grid of measurement points across a defined geographic area (your city, your service territory, a specific county or metro). At each point, it simulates a search query — "plumber near me," "emergency HVAC repair," "family dentist" — from that location and records where your business appears in the results.
The output is a visual map: each grid point shows your rank number at that location. Points where you rank #1–3 (in the Local Pack) are typically shown in one color; points where you rank #4–10 are another; positions beyond 10 (not visible without scrolling past most of the page) are another.
The result looks like a heat map overlaid on your city. Green = you're visible and competitive. Red or faded = you're losing potential customers in that area.
Why This Matters for Service Businesses
The geo-grid view surfaces problems you can't see any other way:
Visibility Gaps
You might rank strongly near your address but fall out of the Local Pack 8 miles away where a competitor's shop is located. Without a geo-grid, you'd never know. With it, you can see exactly which neighborhoods are underserved by your current optimization and decide whether to invest in local citations, landing pages, or review generation targeted at those areas.
Competitor Strongholds
The grid often reveals that a competitor dominates specific ZIP codes or neighborhoods. Understanding the geographic pattern helps you prioritize where to compete versus where to concede for now.
Tracking Improvement Over Time
The most valuable use of geo-grid data is time-series comparison. Run a baseline scan, do 60 days of optimization work (reviews, citations, GBP completeness improvements), then run a new scan. You'll see the grid shift — more green, fewer red zones — as your improvements compound.
This is the difference between guessing whether your SEO work is paying off and knowing.
Campaign Attribution
If you run a localized campaign — sponsor a neighborhood event, earn a backlink from a local publication, build citations in a specific city — a geo-grid scan before and after shows whether it moved your rank in that geographic area.
How the Grid Is Constructed
The technical setup varies by tool, but the underlying process is consistent:
- Define the area: you specify the center point (usually your business address) and the grid dimensions (e.g., 7x7, 11x11, 13x13 — more points = more granular coverage but more scan time)
- Define the spacing: how many miles or kilometers between each grid point (commonly 0.5–2 miles for urban areas; wider for rural)
- Define the query: the keyword(s) you're measuring rank for (e.g., "plumber near me," "emergency plumber")
- Run the scan: the tracker sends queries from each grid point and records your position
- Visualize: results are mapped on the grid with color-coded rank positions
A typical urban service business might use an 11x11 grid with 1-mile spacing, giving 121 measurement points across an 11x11 mile square. This covers most of a midsize US city comprehensively.
What the Numbers Mean
| Grid Position | What It Means for Visibility |
|---|---|
| #1–3 | In the Local Pack — high visibility, most clicks |
| #4–10 | Below the pack but on the local results page — some visibility |
| #11–20 | Second page of local results — minimal organic traffic |
| #20+ | Effectively invisible for that location |
The goal for most service businesses is to maximize the geographic area where you appear in positions #1–3. Each neighborhood you move from #8 to #3 is a direct expansion of your effective service territory from a search visibility standpoint.
Common Patterns and What They Tell You
Strong center, weak periphery: You rank well near your office but poorly across the broader metro. This typically means your proximity advantage is doing the work. You need more reviews and citations to build prominence that extends your reach beyond the proximity bubble.
Strong everywhere except one quadrant: A competitor in that quadrant has a physical location there, or stronger local signals in that area. You can often address this with targeted citation building and location-specific landing pages.
Weak everywhere: An eligibility or foundational issue — incomplete GBP, suspended listing, very few reviews, inconsistent NAP. Fix the basics before reading too much into grid patterns. See how to rank higher on Google Maps for the full foundation checklist.
Strong for one keyword, weak for another: Keyword-level gaps in your GBP services or website content. Adding or improving services listings and on-page content for the underperforming keyword often lifts rankings within weeks.
How Often Should You Run a Scan?
For most service businesses, a monthly geo-grid scan is the right cadence:
- Baseline scan: before you start any optimization work (gives you the starting point)
- Monthly scans: to track progress and catch ranking drops early
- On-demand scans: after a major change (new reviews milestone, new landing page launched, citation campaign completed) to see the impact
Weekly scanning is overkill for most businesses — Google's ranking updates don't move that fast for established listings. Quarterly is too infrequent to catch problems before they cost you significant business.
Geo-Grid Tracking as Part of a Full Local SEO Picture
Geo-grid rank tracking is a measurement tool, not an optimization tactic. The actions that move your grid are the same as the ones that move local rankings generally: more reviews, complete GBP, consistent NAP, local citations, location pages on your website.
The grid just tells you where those actions are working and where they're not — and it gives you a map-based view that's immediately intuitive for a business owner who knows their service territory.
For context on how geo-grid tracking fits into the broader question of how long rankings take to change, see how long does it take to rank on Google Maps.
For the broader picture of what you're optimizing toward, see how to get into the Google Local Pack.
Geo-Grid Tracking in GBP Autopilot
GBP Autopilot includes a built-in geo-grid rank tracker as part of every plan. You set your location, choose your keywords, define your grid size, and the platform runs scans on your schedule. Results are displayed as a color-coded map overlay that makes it immediately clear where you're winning and where you're losing.
Combined with automated SMS review requests (which drive the review velocity that moves your grid), you get both the engine and the dashboard in one tool.
Plans start at $29/month. No contracts, no setup fees.
Sources
- Google Business Profile Help. Tips to improve your local ranking on Google. https://support.google.com/business/answer/7091
- BrightLocal. Understanding Google's Local Search Algorithm and Local Ranking Factors. https://www.brightlocal.com/learn/google-local-algorithm-and-ranking-factors/
- Whitespark. Local Search Ranking Factors 2025. https://whitespark.ca/local-search-ranking-factors/